
Were Adirondack Winters Really Colder in the Past?
Dispatches from the Adirondack Core
As anyone who lived in the central Adirondacks in the 1950s or 60s will tell you, winters aren't what they used to be. Pressed for details, the old timers will tell you that lows of 20 below zero were common and many years brought a night or two with temperatures of 30 below or even 40 below (all temperatures mentioned here are Fahrenheit). Thing is, I've heard enough fish stories over the years to wonder, was it really as cold as the oldsters remember?
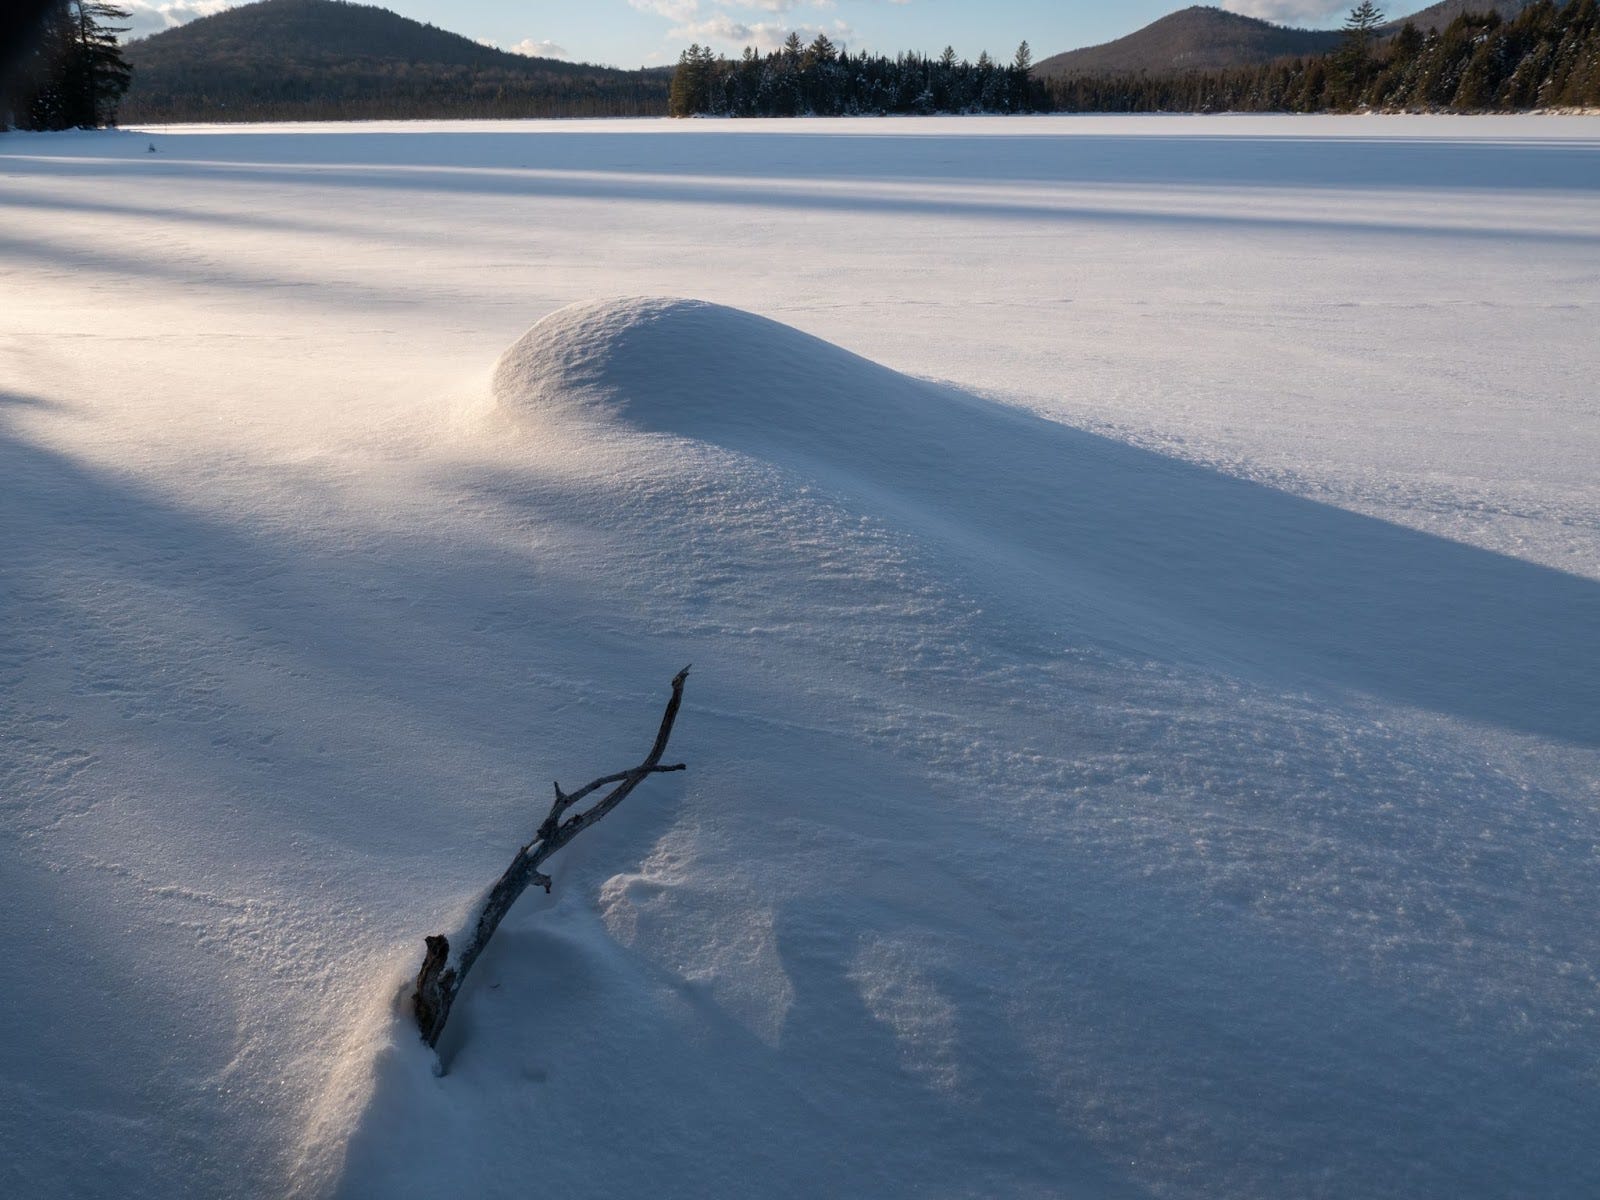
For current residents of the Adirondacks, this year, 2025, has felt like a real winter. Since the first of January, nighttime temperatures have fallen below zero more than 15 times and a couple of nights have been close to 20 below. And it wasn't until February 24th that the temperature rose above freezing for the first time this year. But how does this winter actually compare with the past?
Historic temperature data can be obtained from several sources but records for the Adirondacks are sparse. NOAA, the National Oceanic and Atmospheric Agency, stores and correlates records from different sources and by searching the site I located records from Indian Lake (NY) going back to 1899. This data can be downloaded as a file with the daily minimum, maximum and average temperatures, one row for each day. That's over 45,000 rows so I've included the details of how I analyzed the data at the end of this post. With the data in hand it's straightforward to determine how frequently the low temperature dipped past 20, 30 and 40 below zero as recorded in this dataset.
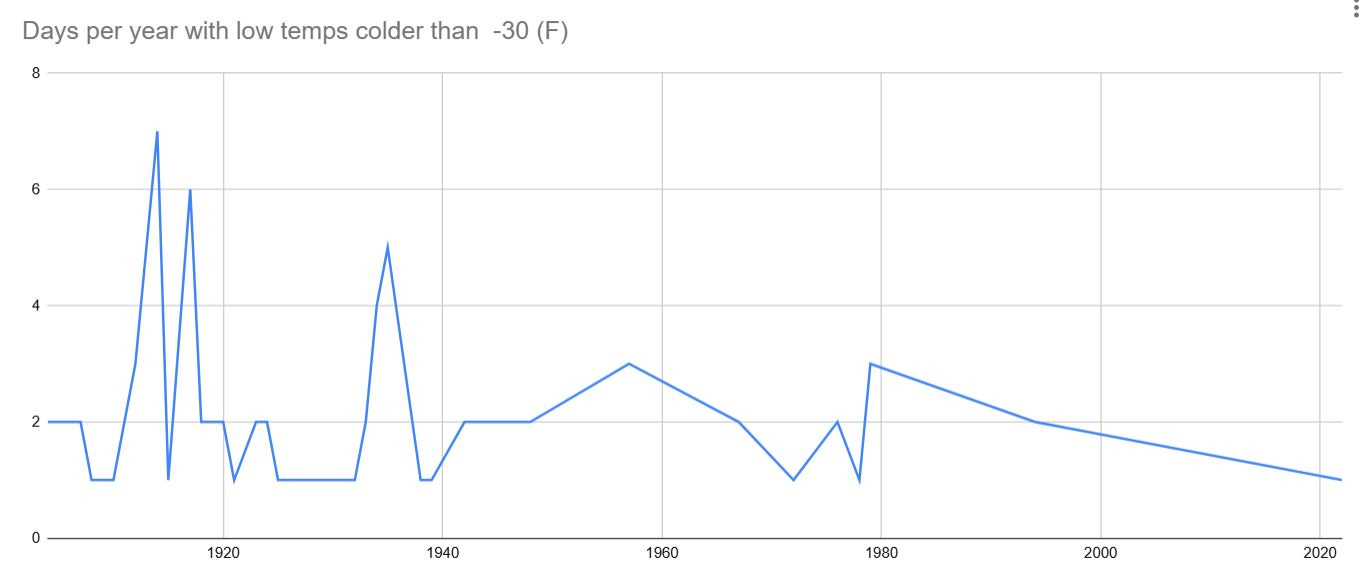
The chart shows the number of times in each year that the low temperature for a day was recorded as -30 or colder. The data runs from January 1, 1900 thru February 22nd of this year (2025) with the years displayed along the bottom and the count of minus 30 lows along the left. At this recording station the temperature fell to -30 or colder a total of 70 times over that 123 year stretch. And it dipped below the mythical -40 on three occasions (once each in 1908, 1917 and 1943).
Based on this data it appears that the old timers have a point. In 1914, for example, there were seven nights colder than -30 and the temperature fell below -30 a total of 21 times between 1910 and 1920. Eleven nights reached the -30 mark in a three year stretch starting in 1933 and ending in 1935 and from 1956 to 1979, a stretch of cold years that still resonate in the memories of many folks alive today, there were 13 nights colder than -30. The real surprise is that since 1980 only 3 nights have been minus 30 or colder.
But data from a single recording station is far from conclusive, so I grabbed a second dataset recorded in Newcomb NY. As the crow flies Newcomb and Indian Lake are only 15 miles apart, though there are mountains in between. The Newcomb data only goes back to 1959, so I could not compare the coldest temperatures in the Indian Lake data, but one surprise did show up. The Newcomb station recorded eleven nights colder than 30 below since 1980 while there were only three in the data from Indian Lake. With a closer look I found that if I used minus 28 as the filter on the Indian Lake data the numbers lined right up. In other words, a lot of lows recorded as minus 28 or minus 29 in Indian Lake were recorded as minus 30 or minus 31 in Newcomb.
Comparing details from the two locations also reveals that both datasets include obvious errors. It seems unlikely that on a given day one of the locations could have a high of 40 with a low of 27 while in the other place it was a high of 36 and a low of minus 2.
The temperature record for Sabattis (16 miles from Long Lake) runs for only three years, 1956 through 1958, but this is where my family lived during those years. And a member of my family is a source for some of the fishy tales of bitter cold temperatures in the past. But I have to admit, based on this data set those stories hold up. In 1957 two nights had recorded lows of 37 degrees below zero and 20 below or colder was common. Maybe it was a flaky thermometer, or maybe the Sabattis thermometer was located in a "frost pocket". A location that accumulates cold air because of the lay of the land. Either way, it appears that it was a bit nippy.
As mentioned, the details of how I did the analysis can be found at the end of this post. And I urge you to look at the data yourself. We swim in a sea of information, and misinformation, so you can accept what the “experts” tell you, or you can claim that it’s all fake, but honesty demands that we sometimes have to dig in and find out for ourselves.
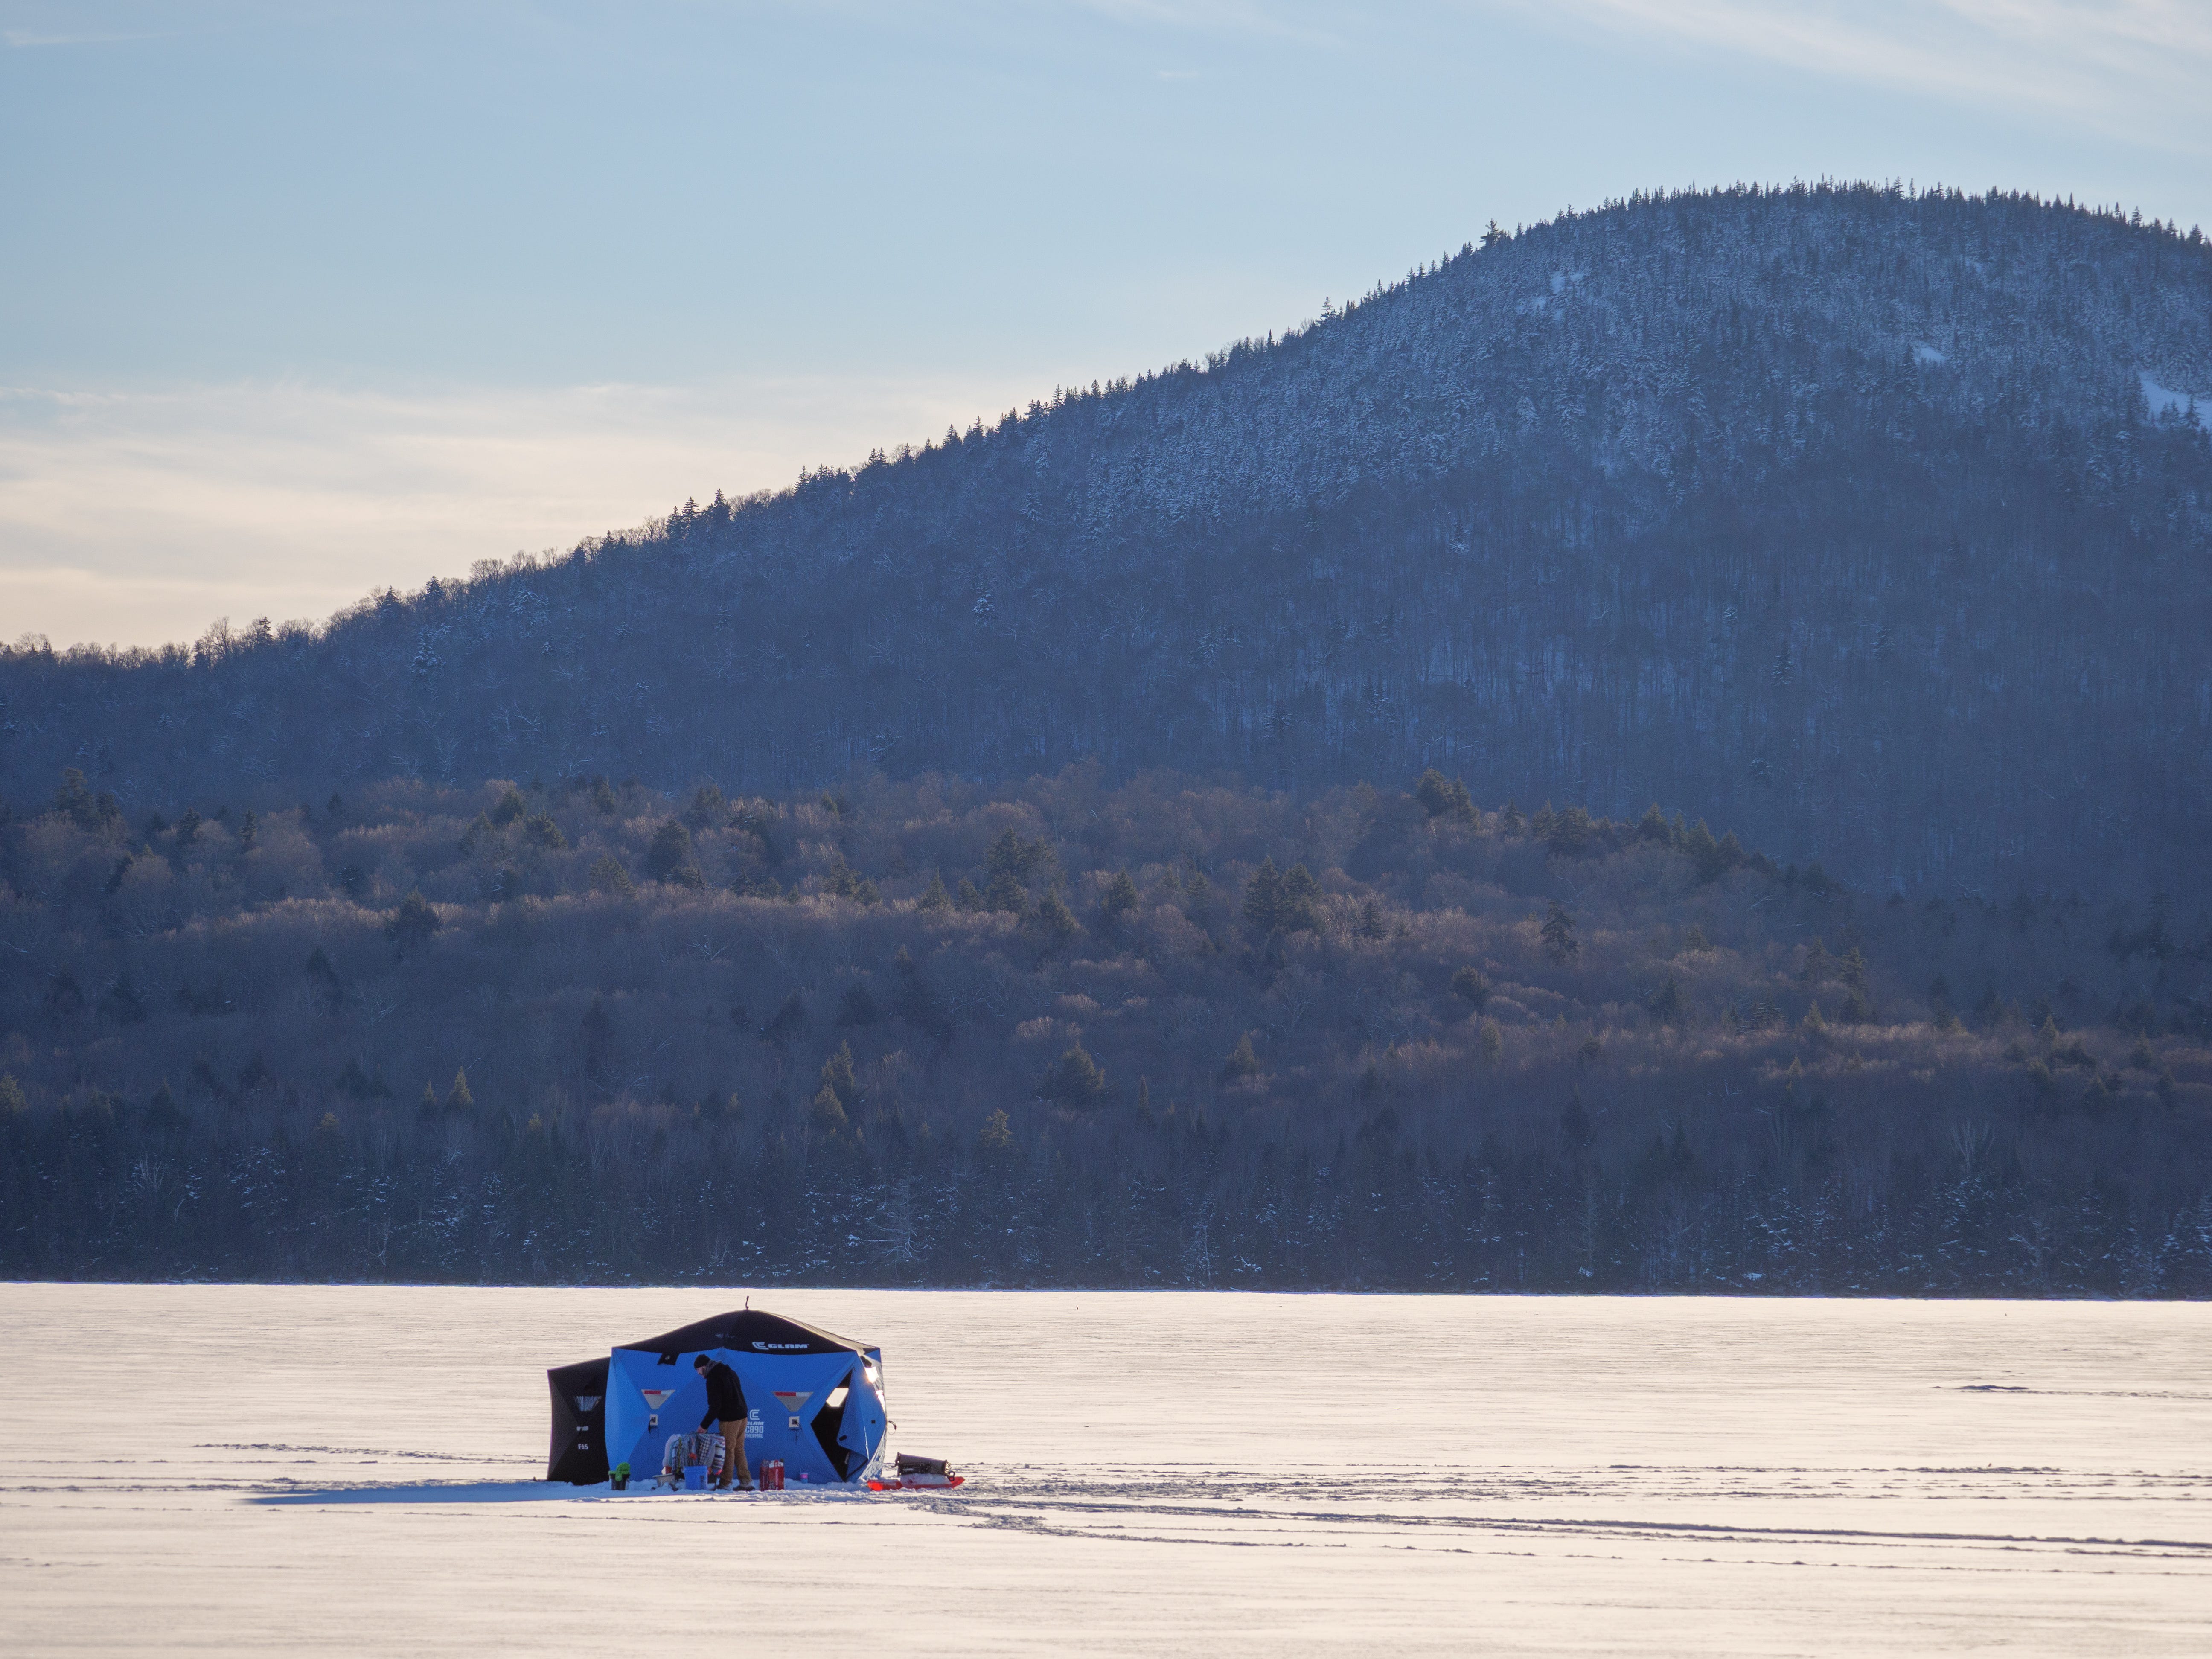
This has been a great year for winter sports enthusiasts in the Adirondacks, almost like the good old days. However, there is a bigger picture. Globally, January 2025 is the warmest on record and while we were cold, the far north was exceptionally warm. In January, Anchorage Alaska had thirteen days with high temperatures above 40 degrees and two of those days hit records of 50 degrees or warmer. Global temperatures are measured by satellite and you can read about the details here or at many other sites.
Analysis of past low temperatures in the Adirondacks
You can find the data that I used at the NOAA website under Historic Data. This link goes to the page where I did the downloads. All three datasets that I discuss can be downloaded from this page.
Or you can select other locations using the map to pan and zoom with dots representing the recording stations you can select. The Indian Lake station (Indian Lake 2SW) provides data going back to January 1st, 1900, that's as far back as you'll find for the Adirondacks. Click on the marker (dot) for Indian Lake and the data page comes up. You can filter the data by date, or download the entire data set by clicking the download button. I use the CSV format.
The downloaded file contains over 45,000 rows with each row containing:
Date,Temp AVG (Degrees Fahrenheit),Temp MAX (Degrees Fahrenheit),min,PRCP (Inches),SNOW (Inches),SNWD (Inches)
The CSV format places a comma between each data element. This format is commonly used for data analysis and you can use a spreadsheet or specialized software to analyze the data. I use Jupyter Notebooks for data analysis but this requires coding using Python. There are hundreds of books, videos and websites dedicated to data analysis if you want to know more. As an alternative, I offer these steps for verifying the results using a spreadsheet.
Load the CSV file into your spreadsheet
Use the "Split text to data" command (Google Sheets) or equivalent. This separates the data into columns.
Sort the entire sheet using the TMIN column
The rows with the coldest temperatures will appear at the top, with the data in the leftmost column. You can count the rows or do further analysis.
Global Surface Temperatures Data And Analysis
Numerous sources can provide the latest global temperature data and analysis. I use the Copernicus project site provided by the European Space Agency. Calculating a global average temperature is not simple or straightforward, and the data on which the calculation is based is very small. So it is perfectly reasonable to question the headline that January 2025 is the warmest January on record.
However, the Copernicus site provides extensive documentation and doubts should be based on facts and not on ideology or emotion.
https://climate.copernicus.eu/copernicus-january-2025-was-warmest-record-globally-despite-emerging-la-nina